Antigravity Efficiency Plugin Recommendations
Antigravity Efficiency Plugin Recommendations
If you are a heavy user of Antigravity, especially if you run multiple Agents simultaneously and frequently switch models, the following plugins can significantly improve your workflow.
1. Chinese Plugin
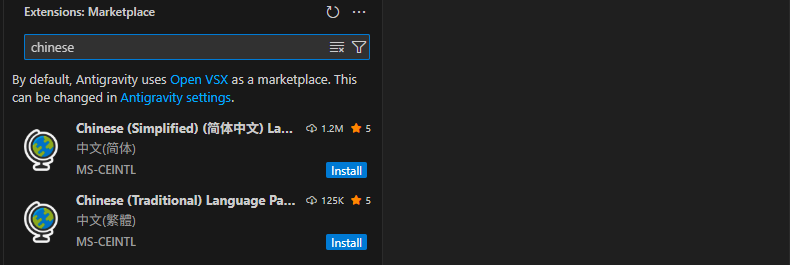
Installing the Chinese plugin can set the Antigravity interface to Chinese. Find the Chinese (Simplified) plugin in the Antigravity plugin market and install it. It is recommended to install the localization plugin before installing other plugins, so that the settings interface of subsequent plugins can also be displayed in Chinese, reducing the understanding cost.
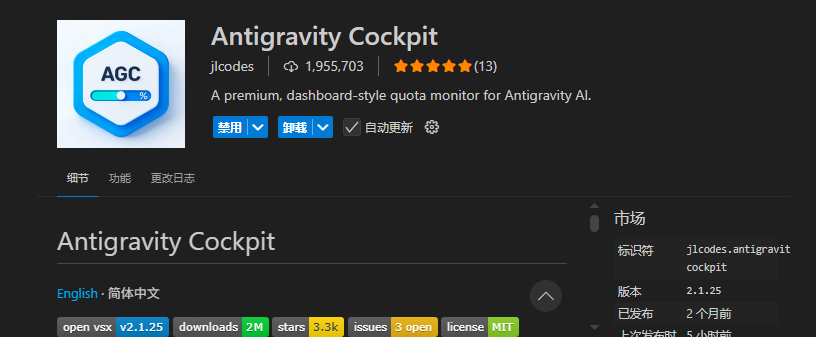
2. Antigravity Cockpit
This plugin can monitor the usage quota of models in real-time. Search for Antigravity Cockpit in the Antigravity plugin market.
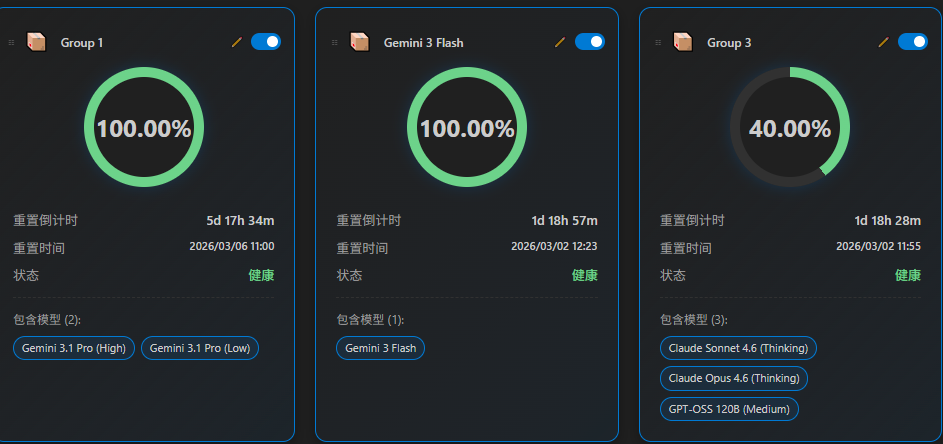
 After installation, click on the status bar in the lower right corner, and click "Open Quota Monitoring Panel" to clearly see the remaining quota of the models.
It is worth noting that in the latest version of Antigravity, Gemini 3.1 has been launched, and Gemini 3.0 Pro has been discontinued.
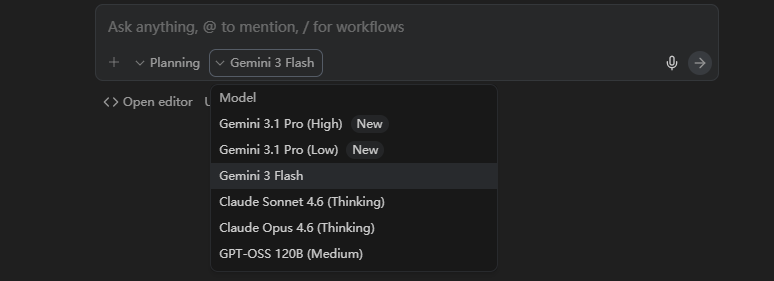 At the same time, you can see that Antigravity has grouped these models; the quota of the models is not calculated based on a single model, but is packaged and calculated by "Group".
This explains a common confusion—why is it that when Claude Opus 4.6 is used to its limit, Claude Sonnet 4.6 cannot be used either? The answer is that these two models are categorized into the same Group, sharing the same quota pool.
If you have a habit of concurrent models, this panel can help you plan your usage in advance, avoiding hitting the quota limit at critical points.
3. Antigravity Quota (AGQ)
This plugin serves a similar purpose to Antigravity Cockpit, but is more lightweight and is also used to display the usage of Antigravity's AI models in real-time.
Users who only need the status bar numbers and do not require a detailed panel can choose AGQ.
4. Graph-It-Live
The core function of this plugin is to render the dependencies between files into an interactive chart in real-time when multiple Agents modify code concurrently.
Its value may be limited in a single Agent workflow, but once you start allowing multiple Agents to operate on different modules simultaneously, changes in the code structure can become difficult to track—if one Agent modifies a low-level file, it can be hard to immediately realize which upper-level dependencies will be affected.
Graph-It-Live visualizes this dynamic process, allowing you to identify structural risks before issues spread.
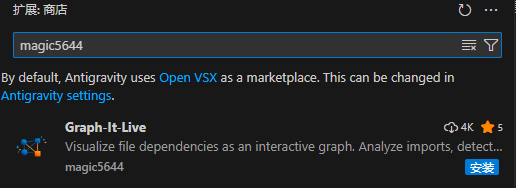
Search for the author's name of this plugin in the Antigravity plugin market and install the Graph-It-Live plugin.
 To use this plugin,
Step 1, invoke the command panel: press Ctrl + Shift + P on the keyboard.
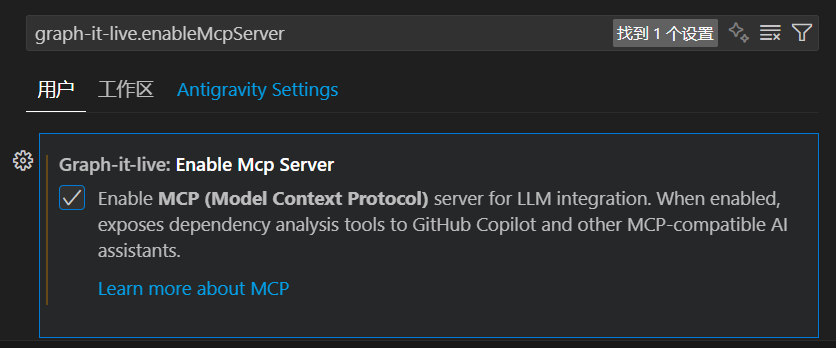
Step 2, search and open basic settings: type in this input box: Open Settings
Step 3, enter graph-it-live.enableMcpServer, enable:
 Step 4, open a relatively complex project and bring up the Graph-It-Live plugin:
Invoke the command panel Ctrl + Shift + P, and directly type Graph or Graph-it in the input box,
 Final output (this is a simple illustration):